The average retirement age in the U.S. is 61, according to Gallup’s 2026 survey of retirees. EBRI’s 2026 survey puts the median at 62. Workers expect to stop later, at 65 or 66.
Many don’t get to choose. In EBRI’s 2026 Retirement Confidence Survey, 46% of retirees left the workforce earlier than planned. Health problems and job changes drove most of those early exits.

What Is the Average Retirement Age in the U.S.?
Retirees told Gallup they stopped working at 61 on average, in a survey taken April 1 to 15, 2026. Nonretirees expect to retire at 66. Gallup’s trend line runs back to 2002.
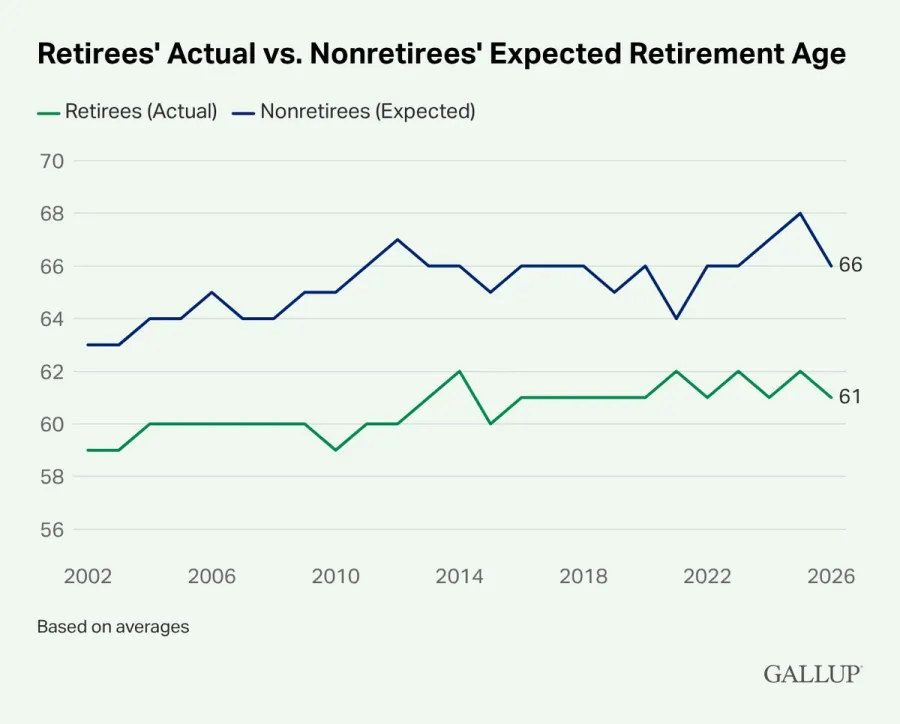
The actual age has stayed between 59 and 62 the whole time. The expected age has climbed from 63, peaking at 68 in 2025. Every year, workers expected to retire two to seven years later than retirees did.
Other sources land higher because they measure different things. New Social Security retirement awards in 2024 went to people who averaged 65.2, SSA data shows. Boldin’s analysis of Census data puts the point where half of workers have left the labor force at about 66.
Each figure answers a different question. Gallup and EBRI ask retirees when they stopped. SSA counts when people claim benefits, which many do after they stop working. Census data captures everyone, including people who keep working well past 65.
What Age Do Most People Retire?
Most people retire before 65. In EBRI’s 2026 survey, 61% of retirees stopped working before 65, and the single most common range was 62 to 64. Workers expect something different:
| Age | Workers Who Expect to Retire Then | Retirees Who Did Retire Then |
|---|---|---|
| Under 55 | 7% | 13% |
| 55 to 59 | 5% | 17% |
| 60 to 61 | 10% | 8% |
| 62 to 64 | 7% | 23% |
| 65 | 19% | 14% |
| 66 to 69 | 13% | 16% |
| 70 or older | 22% | 10% |
| Will never retire | 16% | Not applicable |
Source: EBRI and Greenwald Research, 2026 Retirement Confidence Survey, Figure 13. 1,007 workers and 1,045 retirees surveyed in January 2026. Medians: 65 for workers, 62 for retirees.
Nearly two in five workers expect to work to 70 or not retire at all. One in ten retirees worked that long. Three in ten retirees had already stopped before 60.
What Percentage of People Are Retired by Age?
About half of Americans are retired by 65 or 66, Boldin’s analysis of the Fed’s 2025 Survey of Consumer Finances shows. Fewer than one in six are retired and not working at 60 or 61. By the early 70s, seven in ten have stopped working:
| Age | Retired, Not Working | Retired but Still Working | Disabled, Not Working |
|---|---|---|---|
| 50 to 54 | 2.5% | 0.4% | 6.4% |
| 55 to 59 | 3.9% | 3.4% | 7.2% |
| 60 to 61 | 15.1% | 2.1% | 8.6% |
| 62 to 64 | 28.4% | 5.7% | 6.3% |
| 65 to 66 | 49.7% | 9.8% | 4.8% |
| 67 to 69 | 57.5% | 8.8% | 3.3% |
| 70 to 74 | 69.8% | 10.8% | 1.2% |
| 75 to 79 | 78.3% | 8.4% | 1.3% |
| 80 and older | 87.4% | 3.8% | 2.3% |
Source: Boldin analysis of the Federal Reserve’s 2025 Survey of Consumer Finances. Survey respondents and their spouses or partners, by current work status.
That’s how the average can be 61 while most people in their early 60s are still working. Those who retire early pull the retiree average down. Many others work into their late 60s and beyond, and about one in ten people 65 to 74 call themselves retired but still work.
Why Do People Retire Earlier Than They Planned?
In EBRI’s 2026 survey, 46% of retirees stopped earlier than planned, up from 40% a year earlier. Among them, 76% cited something outside their control, up from 68%. That includes a health problem or disability (41%), changes at their company (35%), and caring for a family member (16%).
Some early exits are by choice. In the same survey, 36% of those who retired early said they could afford to. Many named more than one reason.
Transamerica’s 26th annual survey of middle-income Americans found the same pattern. Some 57% of retirees left the workforce before 65, compared with 48% who had planned to. Among early retirees, 53% gave job-related reasons.
Some of those exits are forced retirements after a layoff or buyout, and others come down to whether you’re ready to stop.
When Do Most People Claim Social Security?
New Social Security retirees averaged 65.2 when their benefits were awarded in 2024, according to SSA’s Annual Statistical Supplement. About 22% of men and 23% of women started at 62, the earliest age allowed.
Full retirement age is 67 for anyone born in 1960 or later. Claiming at 62 cuts a benefit by up to 30%. Each year you wait past full retirement age adds 8%, up to age 70.
Retiring and claiming are separate decisions. You can stop working at 62 and still delay benefits, living on savings in the meantime. You can apply online up to four months before you want benefits to start.
What Is the Average Retirement Age by State?
Retirement age varies by more than three years across states, Boldin’s analysis of Census data shows. West Virginia has the earliest at about 64.4, followed by Arkansas, Idaho, Wyoming, and Kentucky. New Jersey has the latest at about 67.8, followed by Massachusetts, Connecticut, Maryland, and New Hampshire.
These estimates mark the age by which half of a state’s workers have left the labor force. They run higher than Gallup’s 61 because they count everyone, including people who work into their 70s:
| State | Still Working or Job-Hunting at 65 to 69 | Estimated Retirement Age |
|---|---|---|
| Alabama | 30% | 65.8 |
| Alaska | 37% | 66.5 |
| Arizona | 31% | 65.8 |
| Arkansas | 28% | 65.1 |
| California | 37% | 66.7 |
| Colorado | 36% | 66.3 |
| Connecticut | 42% | 67.4 |
| Delaware | 33% | 65.5 |
| District of Columbia | 38% | 66.4 |
| Florida | 33% | 66.0 |
| Georgia | 35% | 66.1 |
| Hawaii | 40% | 67.1 |
| Idaho | 30% | 65.2 |
| Illinois | 36% | 66.4 |
| Indiana | 33% | 66.0 |
| Iowa | 36% | 66.2 |
| Kansas | 37% | 66.5 |
| Kentucky | 28% | 65.2 |
| Louisiana | 31% | 65.7 |
| Maine | 35% | 66.4 |
| Maryland | 43% | 67.3 |
| Massachusetts | 43% | 67.5 |
| Michigan | 30% | 65.4 |
| Minnesota | 36% | 66.2 |
| Mississippi | 27% | 65.3 |
| Missouri | 32% | 65.8 |
| Montana | 34% | 66.1 |
| Nebraska | 40% | 66.9 |
| Nevada | 33% | 66.0 |
| New Hampshire | 42% | 67.2 |
| New Jersey | 44% | 67.8 |
| New Mexico | 32% | 65.8 |
| New York | 37% | 66.5 |
| North Carolina | 33% | 66.0 |
| North Dakota | 37% | 66.3 |
| Ohio | 33% | 66.1 |
| Oklahoma | 32% | 66.1 |
| Oregon | 31% | 65.5 |
| Pennsylvania | 35% | 66.2 |
| Rhode Island | 36% | 66.7 |
| South Carolina | 30% | 65.4 |
| South Dakota | 40% | 67.0 |
| Tennessee | 32% | 66.0 |
| Texas | 36% | 66.6 |
| Utah | 39% | 66.8 |
| Vermont | 40% | 66.9 |
| Virginia | 37% | 66.6 |
| Washington | 33% | 66.0 |
| West Virginia | 24% | 64.4 |
| Wisconsin | 31% | 65.5 |
| Wyoming | 31% | 65.2 |
Source: Boldin analysis of Census Bureau American Community Survey 1-year data for 2023 and 2024, Table B23001. Estimated retirement age is when labor force participation falls to half the rate for ages 45 to 54. Ages between groups are interpolated. U.S. estimate: 66.3.
Is Early Retirement Becoming More or Less Common?
Americans work later than they did 20 years ago, though the shift has stalled. Labor force participation at ages 65 to 74 rose from 22.9% in 2005 to 26.5% in 2015, then held near that level through 2025. At 75 and older, it rose from 6.4% to 8.2% by 2015 and stood at 8.5% in 2025. BLS projects 29.1% and 10.1% for the two groups by 2035.
Early exits haven’t faded. EBRI found that 46% of retirees leave the workforce earlier than they planned. That share rose six points in a single year. About a third of Transamerica’s middle-income workers don’t expect to retire before 70, if at all.
Longer lives raise the stakes. A 65-year-old can expect to live 19.7 more years, CDC data for 2024 shows: 18.4 for men and 20.8 for women. In 1940, it was 12.7 years for men and 14.7 for women. Your own life expectancy may run longer than the average.
Retiring at 61 means planning for a retirement that could run 30 years or more. Some plans need to cover a life that reaches 100.
How Does the U.S. Retirement Age Compare With Other Countries?
The U.S. full retirement age of 67 sits above the current average for developed countries. Across the OECD, the average normal retirement age was 64.7 for men and 63.9 for women retiring in 2024. That’s from the OECD’s Pensions at a Glance 2025.
Most countries are raising it. For people starting careers now, the OECD average rises to 66.4 for men and 65.9 for women. It will reach 70 or more in Denmark, Estonia, Italy, the Netherlands, and Sweden.
How Do You Plan for Retiring Earlier Than Expected?
Plan for your target date and for leaving earlier. Each extra year of work adds contributions and a larger benefit, and it shortens the stretch your savings have to cover. Your own date depends on your savings, health, and job. Four things change when you leave five years early:
1. You save less and withdraw longer. Retiring at 61 instead of 66 means five fewer years of contributions and five more years of withdrawals. That shortens the time your savings have to grow, so the return you assume matters more.
2. Social Security timing becomes a choice. Retiring at 61 doesn’t mean claiming at 62, the first age you can. If savings or part-time work can cover the gap, every year you delay, up to 70, raises your check for life.
3. Health coverage comes first. Medicare starts at 65, so retiring at 61 means four years on a spouse’s plan, COBRA, or the ACA Marketplace. Full-price Silver premiums at 62 often run $1,000 to $1,800 a month, depending on where you live.
4. Your withdrawal rate needs more margin. Money that has to last 35 years supports a lower safe withdrawal rate than money that has to last 30. Test both timelines to see where a plan runs short.
The Boldin Planner runs both retirement dates side by side, with your savings, spending, Social Security timing, and income sources. You can see where each plan lands and which changes help most.
Average Retirement Age FAQ
What age do most people retire?
The typical retiree stopped working at 62, according to EBRI’s 2026 survey, and 61% stopped before 65. The most common range was 62 to 64, at 23%. Workers expect to keep going longer, with a median of 65. Only 10% of retirees worked to 70 or later.
What is the average retirement age for men and women?
Men leave the workforce a little later than women. Half of men have left the labor force by about 66.7, compared with 65.9 for women. That’s from Boldin’s analysis of 2023 and 2024 Census data. New Social Security retirees averaged 65.2 for both men and women in 2024.
How many people retire at 62?
Retiring at 62 to 64 is the most common pattern, covering 23% of retirees in EBRI’s 2026 survey. Claiming at 62 is common too. About 22% of men and 23% of women who started Social Security retirement benefits in 2024 did so at 62, SSA data shows.
What is full retirement age for Social Security?
Full retirement age is 67 for anyone born in 1960 or later. For those born from 1955 to 1959, it falls between 66 and 2 months and 66 and 10 months. You can claim as early as 62 with a smaller check, or wait until 70 for a larger one.
What percentage of people are retired at 65?
About half of Americans 65 to 66 are retired and not working, based on Boldin’s analysis of the Fed’s 2025 Survey of Consumer Finances. That’s up from 28% at ages 62 to 64. Another 10% of 65- and 66-year-olds call themselves retired but keep working.
Why do people retire earlier than planned?
Health and job changes push most early exits. Of retirees who stopped earlier than planned, 76% cited something outside their control in EBRI’s 2026 survey. Health problems or disability topped the list at 41%. Changes at their company, such as downsizing, came in at 35%.